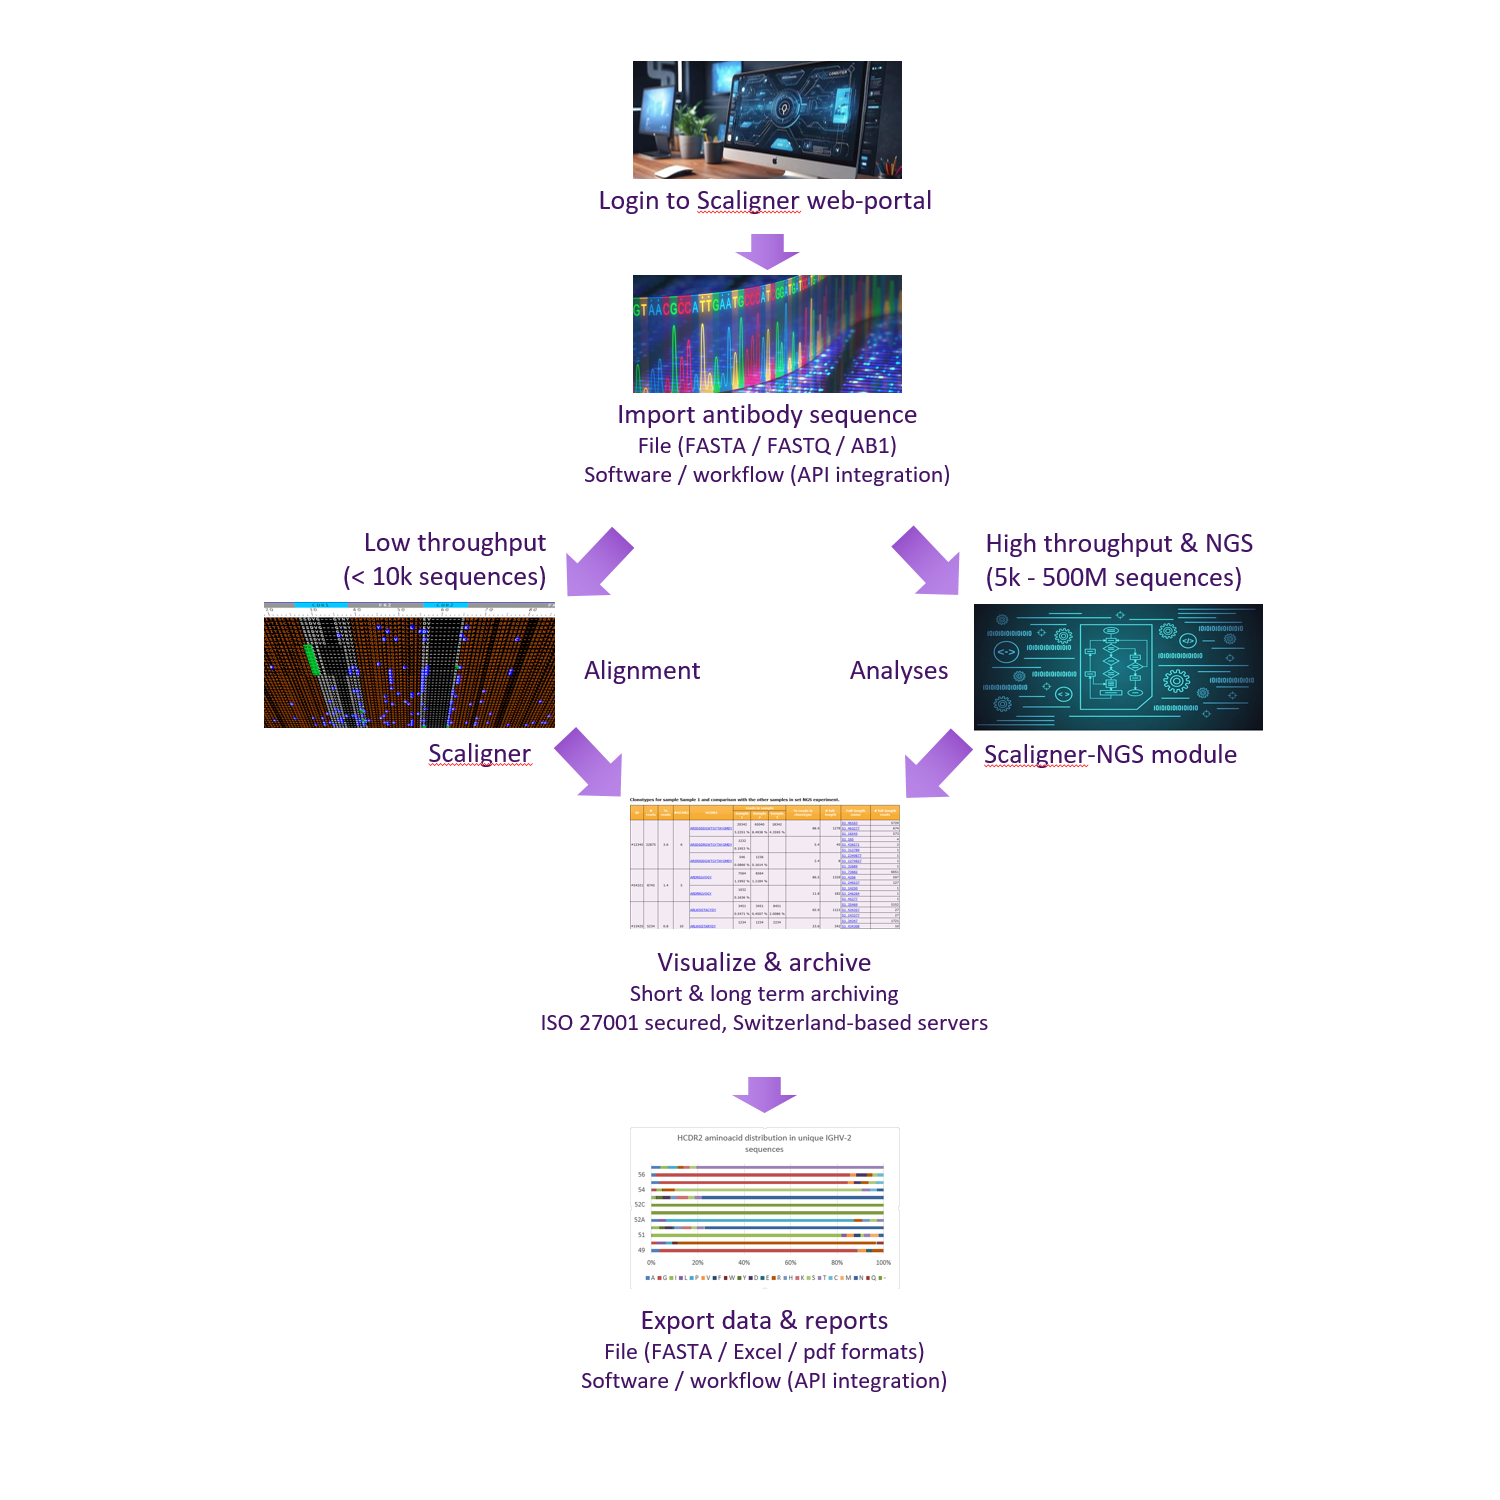
Scaligner™ Cloud-based & On-Premises Platform

Slide Automate sequence alignments according to your choice of numbering scheme (Kabat, IMGT, Chothia, Aho, Martin) Slide Identify the closest germlines Slide Visualize frameshifts, mutations, post-translational modifications and stop codons by color-code Slide Cluster sequences by selected CDRs or framework regions Slide Sort your sequences by similarity to a given sequence or group sequences with identical regions Slide Evaluate sequence humanness

Germline identification

  • Similarity scores
  • Identification of closest germline

Identify liabilities

  • Frameshifts, stop codons
  • Post-translational modifications
  • Mutation frequency

Clustering

  • Group sequence by similarity
  • Frequency analysis

Sequence alignment

  • Sequence comparison
  • Automatic CDR identification

Germline database

  • Align against various species: human, rat, mice, rabbit, llama, etc
  • Add custom germlines or references

Humaneness

  • Predictability for similarity with mouse or human sequence

Start Free Trial

Scaligner-NGS: Next Generation Sequencing Module

The NGS analysis module integrates into your Scaligner™ software pipeline. Its powerful cloud computing platform will assist you to align millions of DNA sequences and extract actionable information from your sequence data at high speed.

Analyze

  • Analyze millions of NGS raw antibody sequences within minutes
  • Annotate and compare NGS sequences without manual intervention
  • Search and filter on large NGS datasets
  • Cluster and index annotated NGS sequences
  • Show cluster diversity and region length plots
  • Base algorithms: FR/CDR identification, germline identification, germline grouping, unique sequence count, similarity and clustering

Visualize

  • Compare clonotypes from different NGS data sets
  • Inspect individual sequences in large data sets using the intuitive sequence viewer
  • Visualize somatic hypermutation (SHM) sites
  • Plot diversity of residues and amino acid frequencies for specific positions for a dataset and for individual germlines
  • Plot CDR length distributions
  • Look at amino acid variability with composition plots

Discover

  • Spot high-level trends in large scale antibody NGS datasets
  • Drill down into individual sequences
  • Achieve deep understanding of your antibody data
  • Accelerate precision antibody discovery

Slide Slide Slide